Percent return on premium, hold time in minutes, calls versus puts, by ticker and by signal. Everything a share journal gets wrong about options, done right.
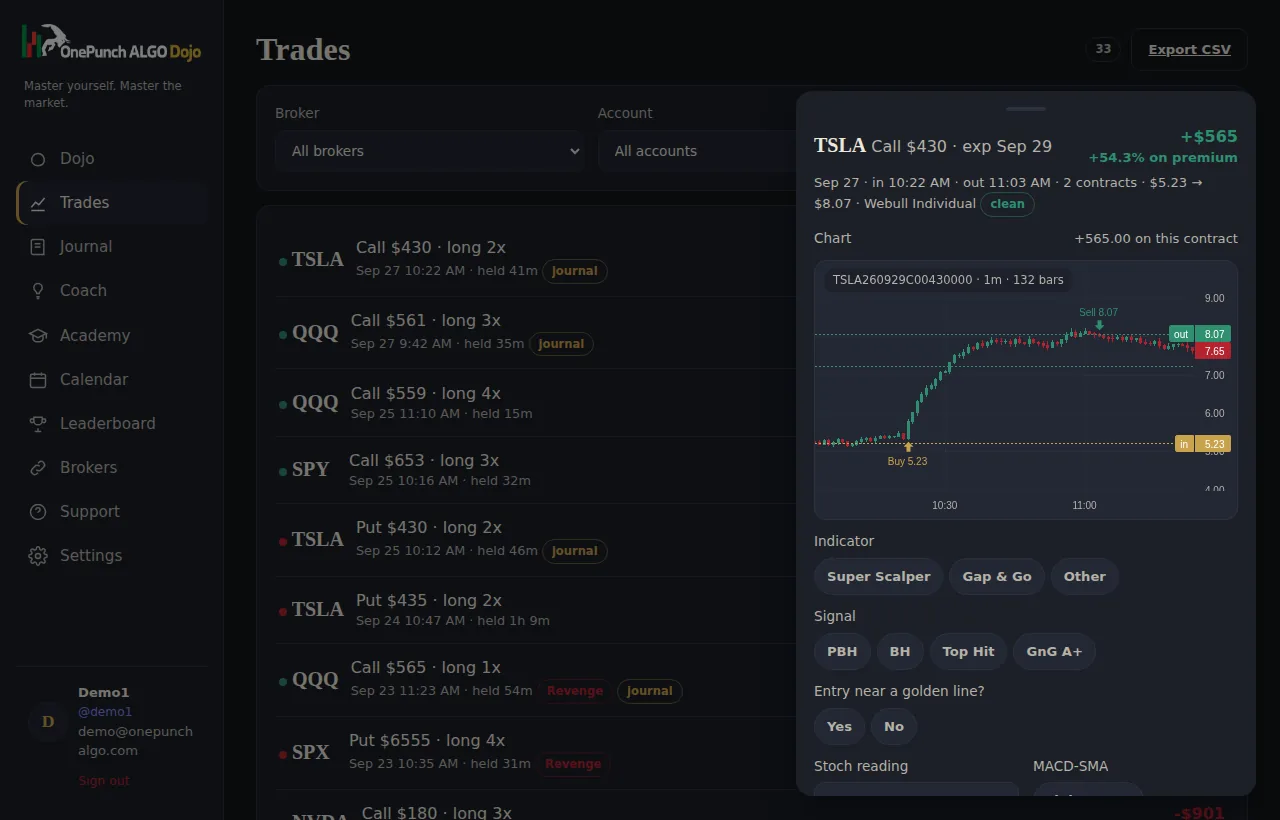
Connect Robinhood, Webull, Schwab, tastytrade, E*Trade or Fidelity once (Interactive Brokers coming soon). Every fill arrives on its own each night, gets paired into trades with entry, exit, hold time and P&L, and is ready to review before the next open. Sub-accounts can be tracked or ignored individually.
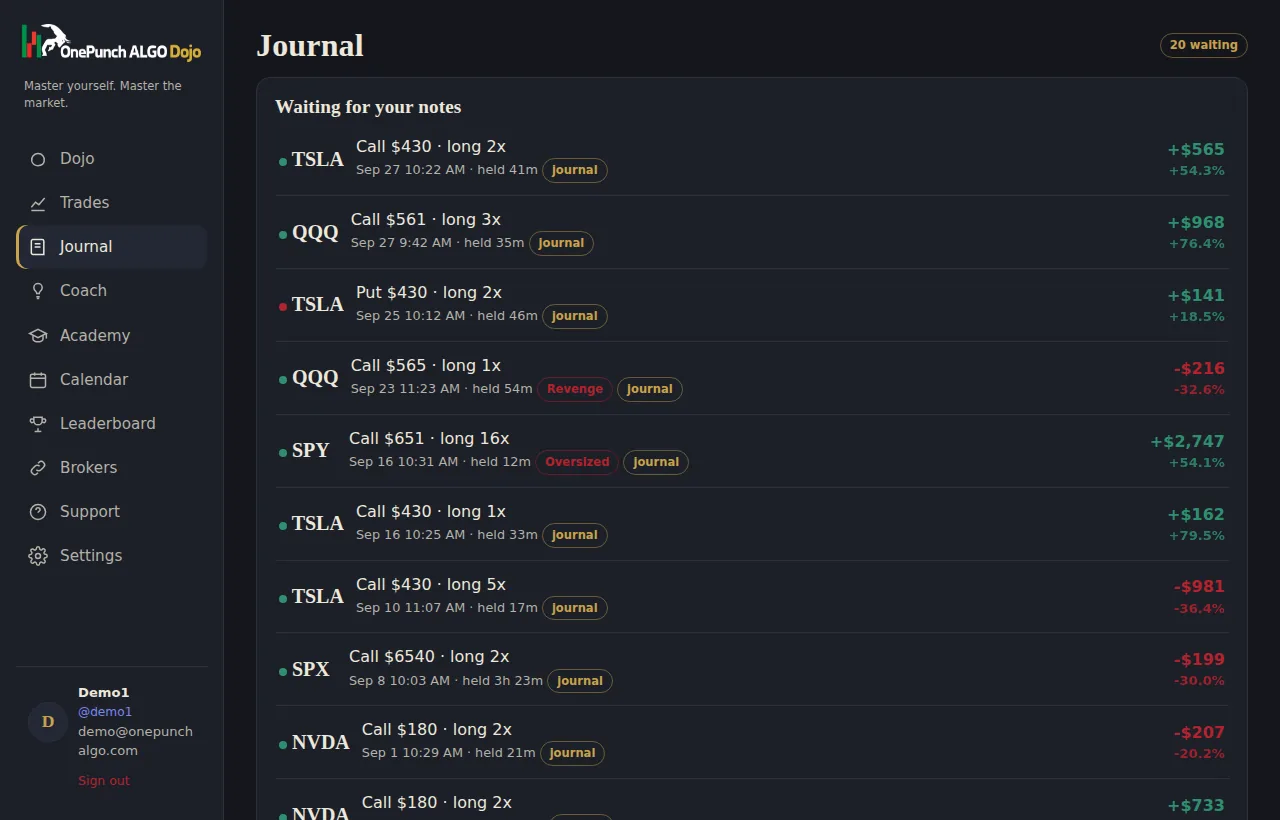
Tag each trade with the indicator that fired, the signal you took, whether the entry was near a golden line, the stochastic reading, the MACD-SMA state, your emotion and a setup grade. Paste up to three screenshots. Five minutes a day.
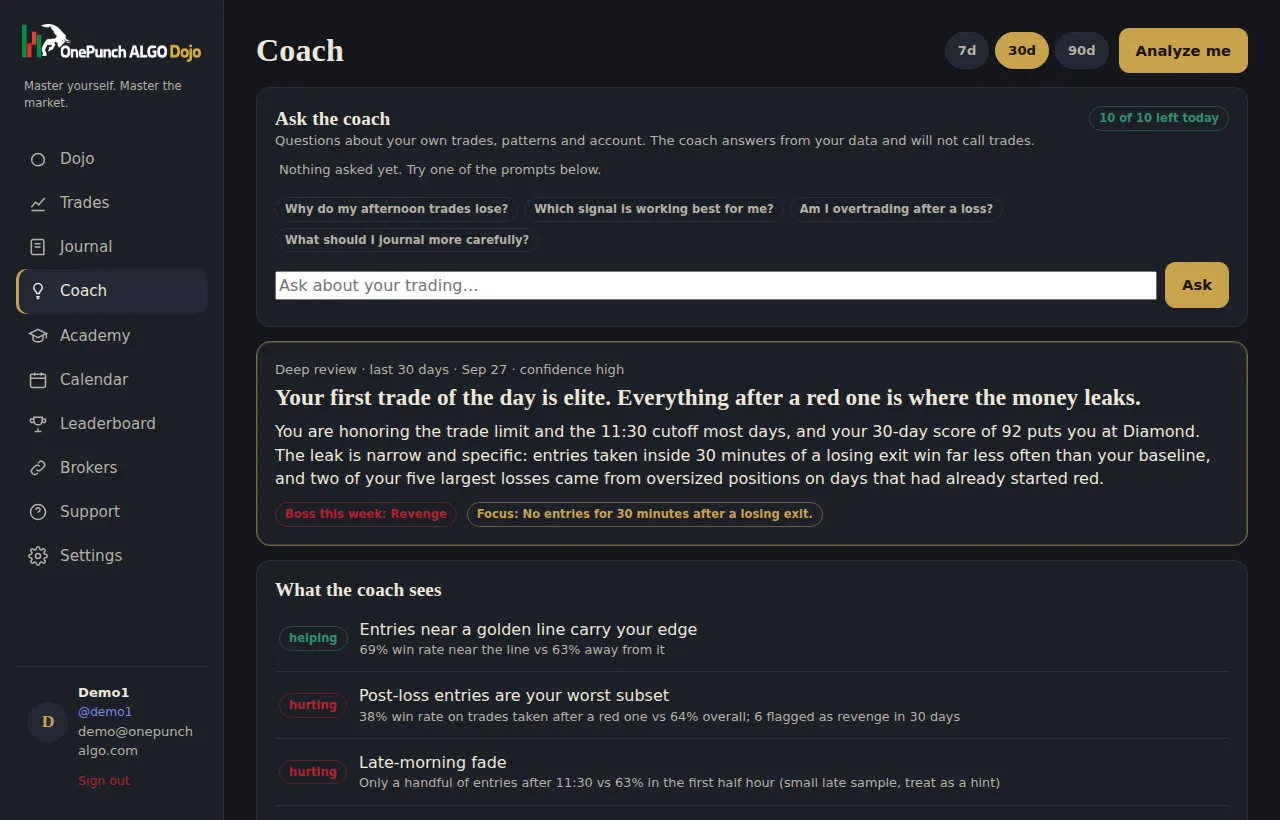
A behavioural review of your last 7, 30 or 90 days: what is working, what is hurting, the one rule to focus on, with the numbers that prove it. Then ask it up to ten questions a day about your own trading. It answers from your data and never calls trades.
Open any trade and see the minute candles of the exact contract you traded, with your buy and sell marked on the chart. Charts run on a free market data key that is yours, so your data stays licensed to you. Two minutes to set up, no card, no data fees.
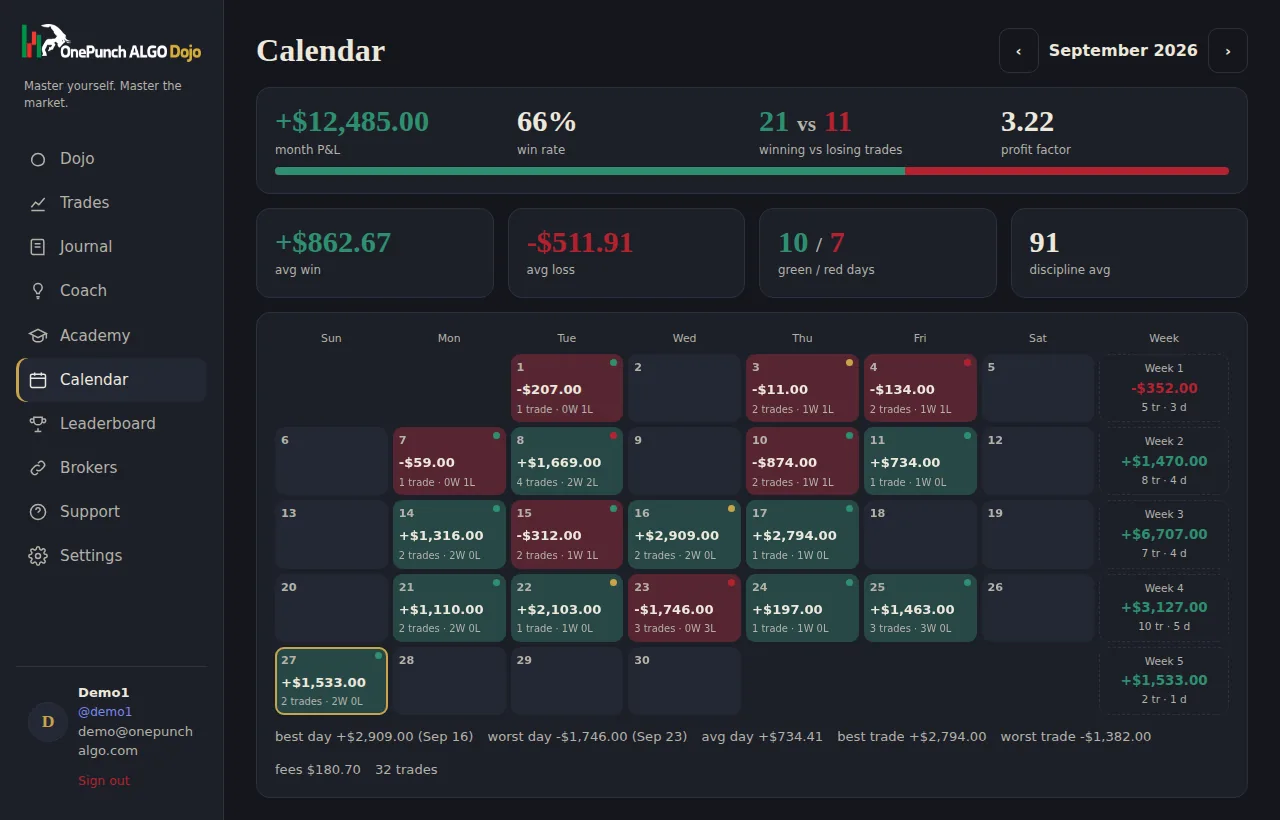
Green days, red days and, more importantly, clean days and broken days side by side. See exactly what a rule break cost you, and how your streaks line up with your results.
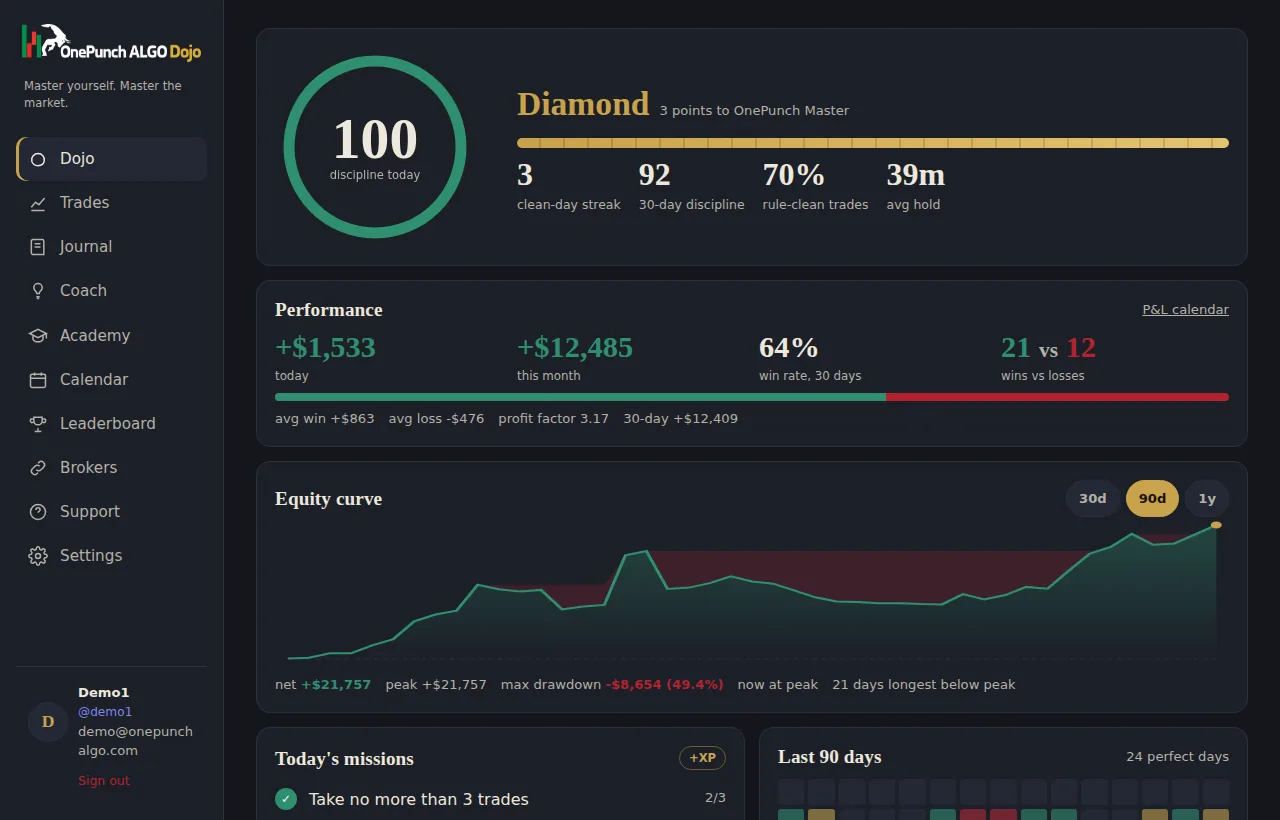
Net, peak, maximum drawdown in dollars and percent, and the longest stretch below your peak, over 30 days, 90 days or a year. Drawn from your real fills, not from a spreadsheet you forgot to update.
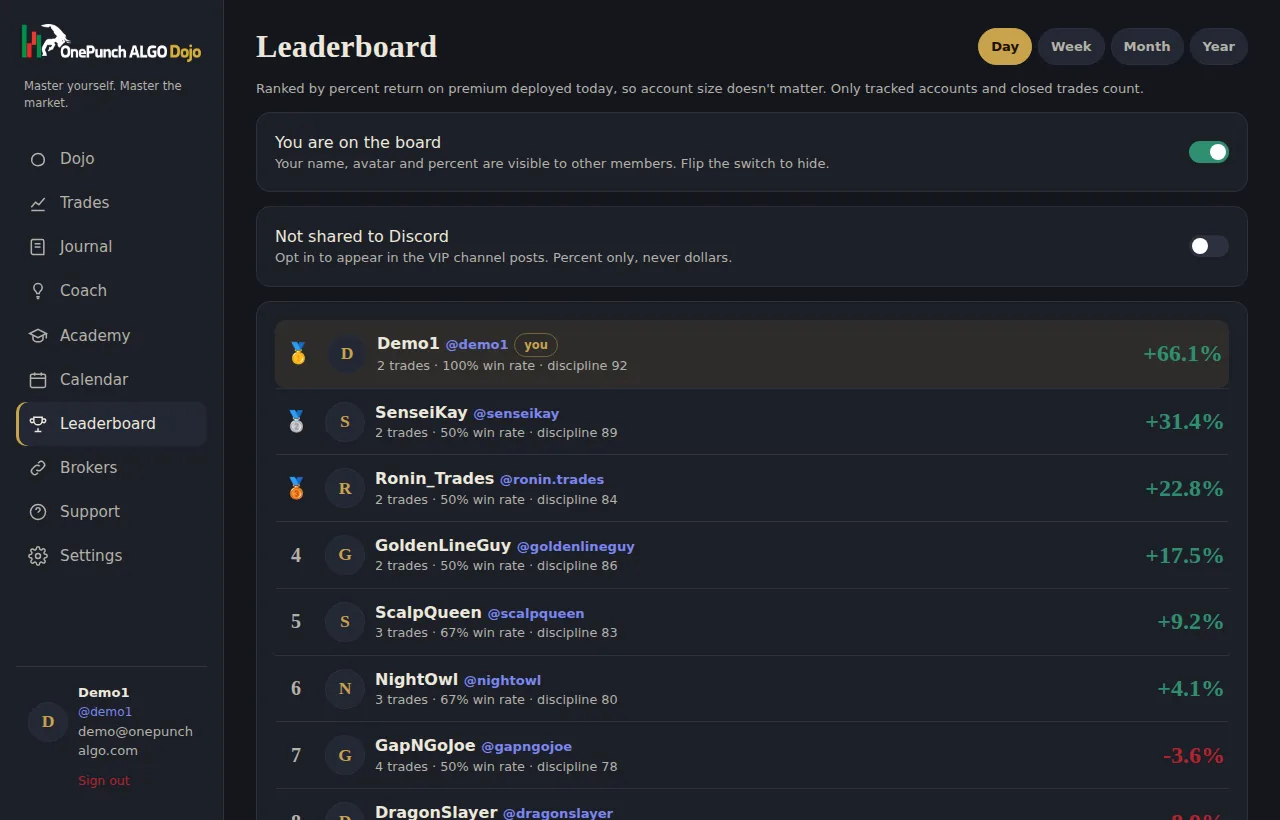
Ranked by percent return on premium, never by dollars, and only if you opt in. Discipline score and certifications show next to your name. Turn it off any time.
Most journaling tools were designed for shares. They measure dollars per share, treat every position as linear, and ignore time decay. Options behave differently. A small move in the underlying can double a contract or erase it, the same dollar loss means something very different on a $50 premium than on a $5,000 one, and holding time matters because every minute costs theta.
An options trading journal has to measure what option traders care about: percent return on premium, hold time in minutes, calls versus puts, the strike relative to price, and how results change by expiry and time of day. That is the foundation this options trading journal is built on.
Every fill is paired into a complete position with average entry and exit, number of contracts, hold time and percent return on the premium you paid or collected. Partial fills and scale-ins are grouped, so a position built in several clicks still reads as one trade. Calls and puts, long and short, are all supported.
On top of that, each day is graded against the rules you wrote: maximum trades, cutoff time, size limit and pause after a loss. The discipline score and belts reflect process, not profit, because a careful losing day is progress and a reckless winning day is a warning.
The part most traders never record is where the underlying was when they entered. The Dojo reads the underlying minute chart and records it for every position, across your whole history: distance from VWAP and its bands, the 9 and 20 SMA, stochastic and MACD, whether the entry came on a close through a level or a retest, and the OnePunch trading wave.
Your side of each option trade journal entry takes about thirty seconds: the indicator and signal, whether you were near a golden line, your emotion, a grade and an optional note or screenshot. With both layers in place, the coach can finally answer the questions that matter.
Which of my setups actually pays, and which only feels productive? Do my retest entries beat my early entries? What happens to my results after my second loss of the day? Am I better on calls or puts, and in which trading wave? How do I trade on CPI and FOMC days compared with ordinary sessions? Does my win rate hold when I size up?
The Dojo answers these from your data. The AI coach quotes the trade counts behind each answer and flags small samples, so you can separate real patterns from noise. It reviews behaviour only and never suggests trades.
Look for automatic broker sync so you never type fills, percent-on-premium metrics instead of dollar-per-share, automatic market context, a way to measure discipline rather than only profit, and honest analysis with sample sizes. The Dojo syncs Robinhood, Webull, Schwab, tastytrade, E*Trade and Fidelity read-only, with Interactive Brokers coming soon and CSV import for anything else.
Add a P&L calendar with economic releases, charts of every contract with entry and exit marked, a daily plan with adherence scoring, Academy courses with certifications and a percent-only leaderboard if you opt in, and you have an options trading journal designed around how option traders actually improve. That is the standard any options trading journal should meet.
It is built with active option traders in mind, from same-day scalps to multi-day swings. The metrics and scoring work across holding periods.
Yes. Short positions record the premium collected and percent return is measured on that premium.
Robinhood, Webull, Schwab, tastytrade, E*Trade, Fidelity and Webull Canada, read-only. Interactive Brokers is coming soon, and CSV import covers others.
No. VWAP, bands, SMAs, stochastic, MACD, entry type and trading wave are calculated automatically from market data.
Dojo Access is $19 a month with every feature included.
$19 a month. Sync your broker tonight, meet your coach tomorrow morning.
Subscribe for $19/month See the live demo