See daily results and discipline side by side, weekly totals, and an equity curve with drawdown.
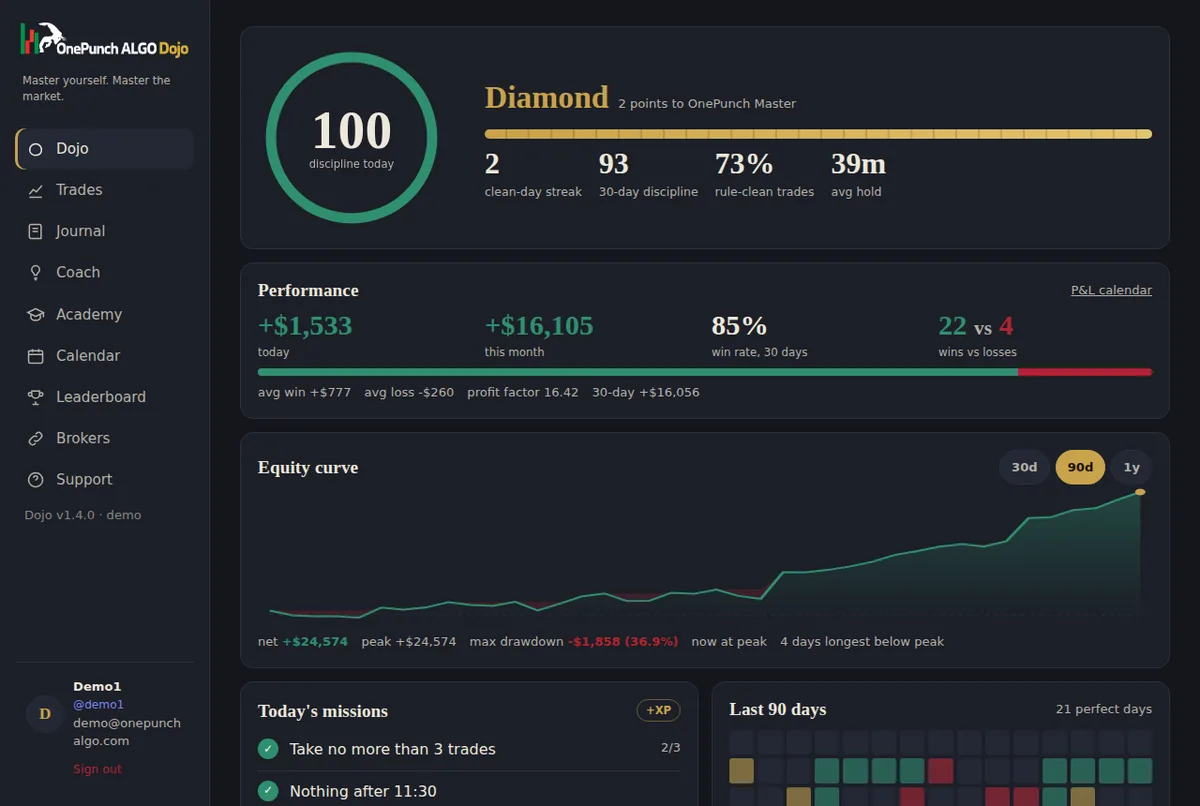
Screenshot from the Dojo demo, with demo data.
Each day shows your result, number of trades and win rate, with a discipline marker and any market events. Weekly totals sit on the right.
The last 90 days as a grid coloured by discipline, so streaks and bad weeks stand out at a glance.
Your running result with peaks, maximum drawdown and the longest stretch below your peak, over 30 days, 90 days or a year.
Every trading day is graded from 0 to 100 against rules you set yourself. Belts move on process, never on profit.
Find any trade by ticker, strike, note or signal, filter wins, losses and rule breaks, tag trades your way and save the views you use most.
$19 a month. Sync your broker tonight, meet your coach tomorrow morning.
Subscribe for $19/month See the live demo